Posts

Investigating House Prices
Image
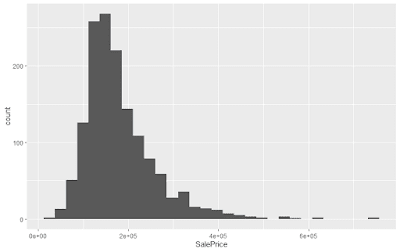
Having now learnt a variety of machine learning models, as well as evaluative methods, it was time for some light practice using an old Kaggle dataset on house prices. Predicting house prices have a variety of applications from prospective buyers estimating the price of a house based on desired features to homeowners who wish to value their house before selling. While the entire analysis was carried out in R, I did a few cleaning bits in Python too to gain further practice. Data Exploration The training dataset is quite small, with only 1460 observations and about 79 variables. These variables included a variety of salient features about houses, including the neighbourhood, square footage, details on the number of rooms, whether the house has a fireplace, pool, garage and so on, as well as the age, and so on. Let's first begin by exploring the data. Here is the distribution of house prices. We can see that the distribution is skewed to the right, with most houses around t...
Modelling Probability of Loan Default

Image
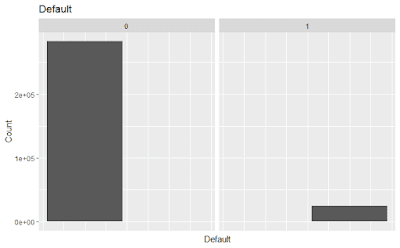
When banks and other financial institutions evaluate a loan request, they must ascertain the risk of default. Defaults can be very costly to banks and predictive analytics can be deployed to help banks make the right decisions. This project involves using a past Kaggle competition to model default of a customer based on many different features. Data Exploration The dataset comprises over 300,000 customers with over 100 features; it is quite a large dataset packed with data. Let's try to make sense of it. It gives demographic and financial information of a customer and then says if he/she defaulted on a loan. Let's first get a broad-level overview of the fraction of defaults. The bank issues both cash loans and revolving loans. The latter are flexible loans and are rather open-ended. Let us see how default rates vary based on the type of loan. It seems that a smaller proportion of revolving loans,...

What's Popular in Music? Let's analyze!

Image
I know nothing about music. This makes it ideal as a topic for me to study and apply data without any (informed) misconceptions. This exploration is really just an expansion of what a team of two other students and I did for a Data Competition at the Fuqua School of Business. The competition involved creating the dataset. For this pet project, I also created some analysis. Acknowledgements I want to thank the Master of Quantitative Management team at the Fuqua School of Business and the Fuqua School of Business as a whole for giving us the opportunity to participate in this competition and further build our data collection and analysis skills. I would also like to thank my teammates in the competition, without whom the dataset which I have analyzed further would not exist. Data The data comprises the top 20 songs and their respective artists from the year-end US Billboard Hot 100 for the years 2006 to 2018. The data was scraped from the US Billboard website. Song metrics were ob...